
A production build died on one page. /c/creative-tim-ui/scroll-area alone, while every other read in the same run answered fine. The build had started immediately after a forty-minute crawl, so the write had drained the instance's disk-IO burst budget, and that one index page had to come off disk.
Before that there was a worse version of the same failure. fetch has no default timeout, and in a static build a stalled database is a hang rather than an error: the build worker sits at 0% CPU with nothing more on stdout, indistinguishable from a slow compile, and it never returns. So every read got a deadline.
Adding the deadline created the real problem. There were now two different timeouts reaching the same catch block, and they mean opposite things.
What 57014 actually tells you
57014 is Postgres' own query_canceled, which is what a statement timeout raises. It is easy to read as "this query is too expensive". Here it is not. The plan is fine: blockdex_search('calendar') costs 305ms warm and EXPLAIN shows the GIN index doing its job. On a small shared instance the buffer cache is small enough that the first query to touch a given corner of that index reads it off disk, and the disk is the plan's binding limit. The second identical call lands in 300ms because the pages are now resident.
So a 57014 means the query has not been asked recently, and asking again is the fix.
/** 57014 is Postgres' own query_canceled: a statement timeout, and the one shape worth a retry. */
function retryable(body: string): boolean {
  return body.includes('57014');
}

for (let attempt = 0; ; attempt++) {
  const res = await fetchWithDeadline(url, init);   // throws on deadline, never retried here
  if (res.ok) return res.json();

  const body = (await res.text()).slice(0, 300);
  if (attempt === 0 && retryable(body)) continue;   // cold index, ask once more
  throw new Error(`supabase ${res.status}: ${body}`);
}
The check reads the SQLSTATE out of the response body rather than branching on the HTTP status. A bad argument would otherwise be sent twice, and it will fail identically both times.
The client deadline gets the opposite treatment. Twenty seconds is well past the slowest legitimate cold read on this data, so silence past it means the instance is not answering anybody. That is a real condition here: when the shared free-plan instance drained its burst budget on 2026-08-01 and again on 08-02, every /rest/v1/* request across every product hung indefinitely rather than answering. Retrying costs a visitor another twenty seconds and returns the same nothing.
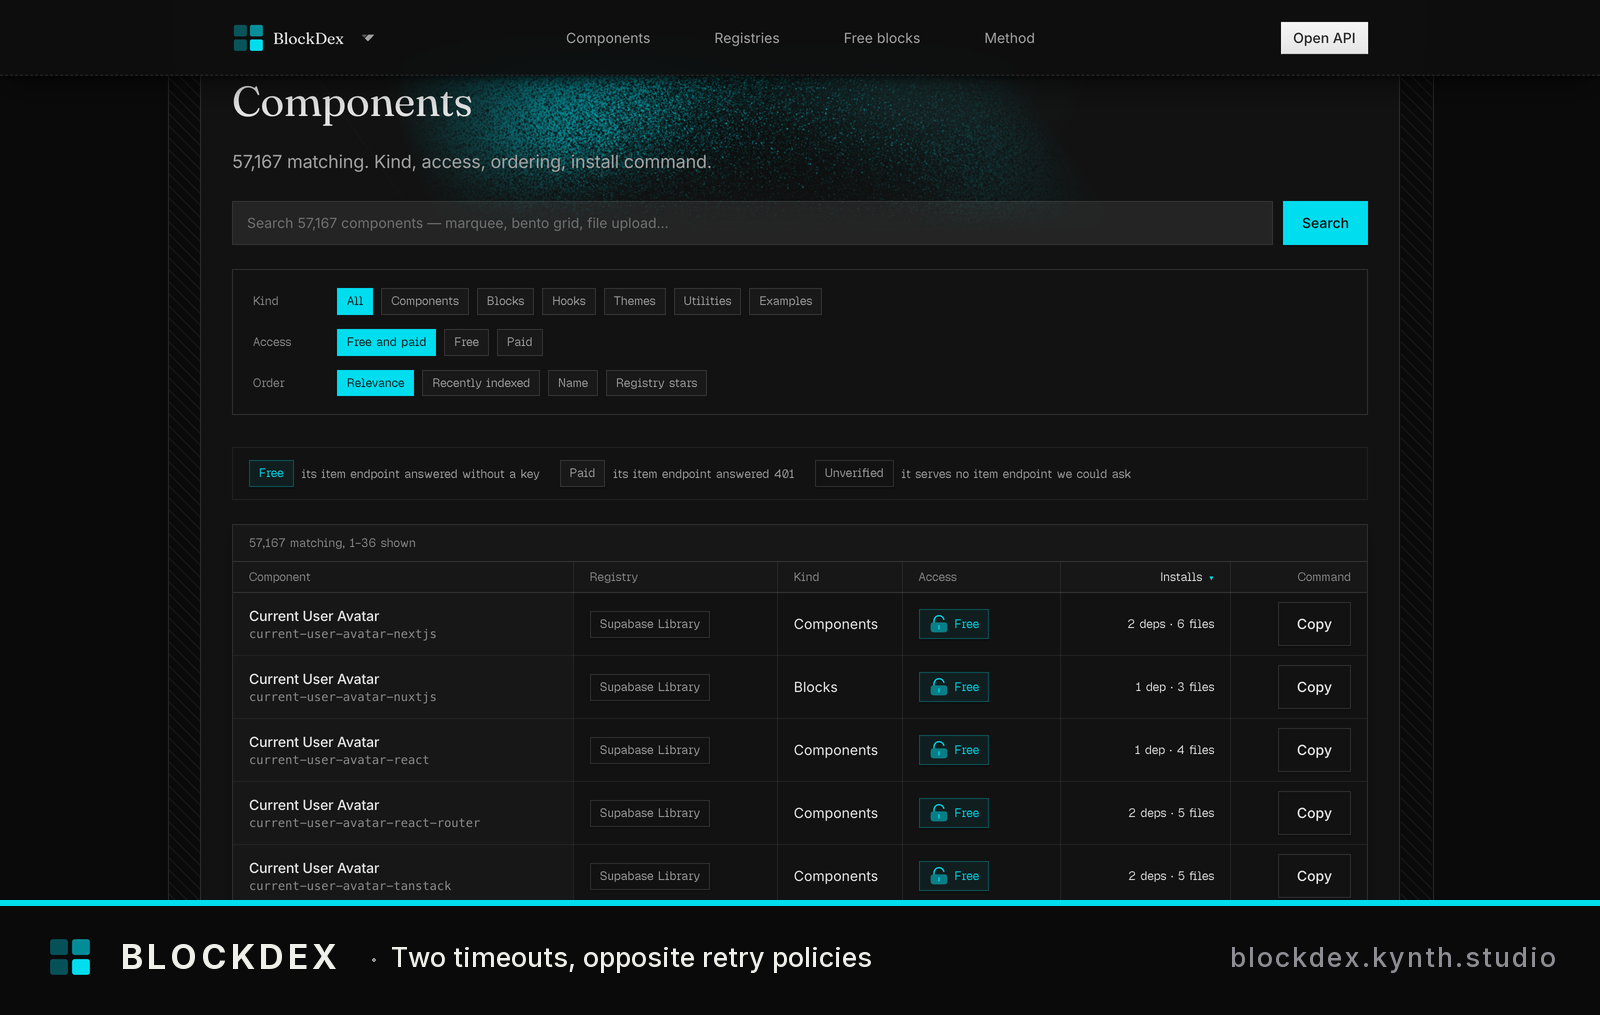
Component browser interface showing 57K+ matching items with search and filters — A populated component library with selectable items and real data.
A build is not a visitor
The reasoning above assumes someone is waiting. At build time nobody is, and the arithmetic inverts: next build renders 152 pages in one pass, and one cold read that goes quiet takes down a deploy after several minutes of work that was going fine. So the deadline reads the build phase and changes both numbers.
const BUILDING = process.env.NEXT_PHASE === "phase-production-build";
const DEADLINE = BUILDING ? 60_000 : 20_000;
const DEADLINE_TRIES = BUILDING ? 2 : 1;
Client deadline (AbortController) | Postgres 57014 | |
|---|---|---|
| Raised by | our own setTimeout aborting the fetch | the database cancelling its own statement |
| What it signals | the instance is not answering anybody | that corner of the GIN index is not resident |
| Second identical call | still silent | 305ms warm, measured on blockdex_search('calendar') |
| Retried serving a request | no, the page renders its "did not answer" state | once |
| Retried during a build | once more, at 60s | once |
Two minutes is a hard stop well inside a sane deploy, and it cannot mask a dead instance, because the deploy script already refuses to build when PostgREST is not answering at all.
Then delete the cause
A retry is a mitigation and it does not make the read cheap. blockdex_stats used to be a plain view recomputing fourteen aggregates across the whole corpus on every page render. At 57,000 items that costs 2.8 seconds warm and goes past the statement timeout cold. It is a materialized view now, refreshed as the last step of the nightly crawl, and a refresh that fails fails the entire run rather than warning, because the visible result is a site serving the previous crawl's counts under the previous crawl's date.
One more place this landed: /api/health read blockdex_stats cold, timed out, and answered 503. An uptime probe would have paged about a database that was fine and had simply not been asked anything for a while. That route now returns 200 with ok: false when the data is stale, and reserves 503 for an unreachable database, because a working API over a failed crawl is a different incident.
That's how we built BlockDex.
One shipped product, taken apart, once a month. What it does, what it cost to build, what the pipeline behind it looks like, and what the numbers did — read off the repository and the live site, not written from memory. Join the list.
← All writing